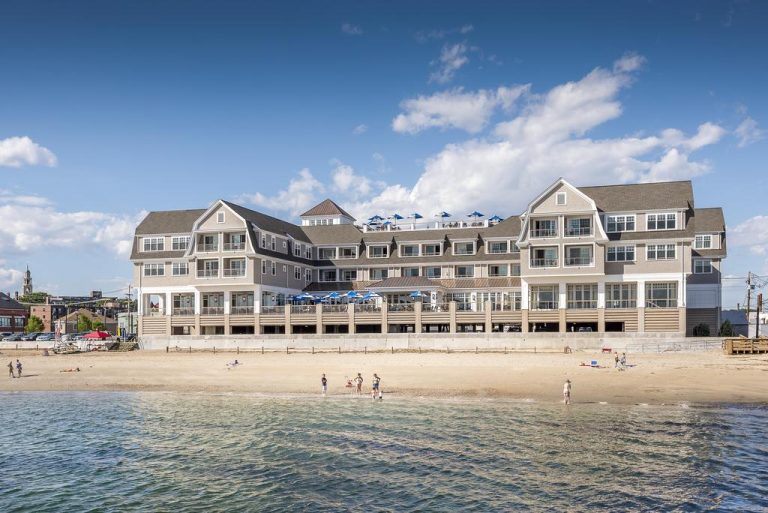
Gloucester has a $320 million in Designated Port Area (DPA) revenue, according to a Massachusetts report issued this past summer. The “Assessment of Massachusetts’ Designated Port Areas,” conducted by Coastal Zone Management and the Department of Environmental Protection found that Gloucester is the 3rd largest port in the Commonwealth, based on employment and maritime revenue/acre. A summary table is found below.
| DPA | Employment | Revenue (Millions) | Acres | Employment/Acre | Revenue/Acre |
| New Bedford-Fairhaven | 1,409 | $551.41 | 598 | 2.356187291 | $0.92 |
| South Boston | 1,047 | $416.26 | 140 | 7.478571429 | $2.97 |
| Gloucester | 838 | $319.99 | 215 | 3.897674419 | $1.49 |
| Weymouth Fore River | 427 | $326.56 | 652 | 0.654907975 | $0.50 |
| Mystic River | 305 | $118.74 | 357 | 0.854341737 | $0.33 |
| Chelsea Creek | 270 | $117.60 | 261 | 1.034482759 | $0.45 |
| East Boston | 186 | $81.65 | 89 | 2.08988764 | $0.92 |
| Mount Hope Bay | 123 | $82.27 | 164 | 0.75 | $0.50 |
| Salem Harbor | 29 | $42.07 | 112 | 0.258928571 | $0.38 |
| Lynn | 16 | $1.40 | 166 | 0.096385542 | $0.01 |
In addition to the acreage, revenue and employment for each of the 10 DPAs in Massachusetts, we have “normalized” the data to allow us to look at revenue/acre and employment/acre. Based on these numbers, Gloucester is relatively high at 3.9 employees per acre. New Bedford comes in at 2.36 and South Boston at 7.48. Our $1.49 million in revenue/acre is also healthy, according to EDIC Chair Tom Balf. With respect to property tax revenue, Gloucester generates approximately $4 million in property tax compared to $34 million for New Bedford.
These numbers point to the fact that the port of Gloucester continues to be an economic driver for the City and the northshore. Contact the EDIC or the City’s Economic Development Coordinator, Emily Sloane, for more information about how your business can thrive in this 400-year old seaport.